Carolyn Shaffer
Seeking New Opportunities
Exploratory Data Analysis - Data Visualization - Python Pandas - Tableau
Exploratory Data Analysis - Data Visualization - Python Pandas - Tableau
Junior Data Analyst with a certificate in data analytics from the University of Wisconsin and 5+ years of experience in information sciences, engineering and graphic design. Proven technical and leadership aptitude in Python, Pandas and data visualization tools such as Matplotlib and Tableau. Qualifications encompass partnering with community organizations and businesses, leadership, and teams to define needs through strategic planning, and data analysis best practices to enhance problem-solving capabilities and improve services. Well versed in budgeting and presenting to boards of directors and driving collaboration across varied regional partners. Finds great satisfaction in preparing clean data, exploratory data analysis and creating clear and effective data visualizations for the purpose of virtuous decision and policy making.
Data Bootcamp Certificate
A 24-week intensive program focused on gaining technical programming skills in Excel, VBA, Python, R, JavaScript, SQL Databases, Tableau, Big Data, and Machine Learning
B.F.A. Illustration
M.L.S. Library & Information Sciences
M.S. Electrical Engineering
B.S. Electrical Engineering
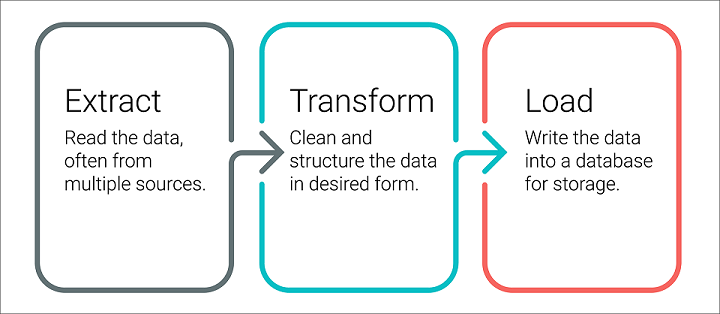
For this project, data from both Wikipedia (web scraping) and Kaggle (csvs) were combined and saved into a SQL database so that hackathon participants had a nice, clean dataset to use. To do this, the ETL process was completed: extract the Wikipedia and Kaggle data from their respective files, transform the datasets by cleaning them up and joining them together, and load the cleaned dataset into a SQL database.
This project is designed to use a web browser to serve an interactive dashboard through which to view volunteer's belly button bacteria for the purpose of culturing it for synthetic food production. The dashboard is designed to display the database of types of bacteria present in each volunteer, by their ID number, as well as their frequency of washing.

Data analysis was conducted on the CitiBikes bike sharing program in Manhattan to see what insights could be gleaned and applied to a proposed bike sharing program in Des Moines, IA. Several factors were studied. They included demographics of customers, time of day of highest use of bikes and weekday usage. Subscriber vs customer (tourist) usage was also considered. A presentation was created for potential investors.
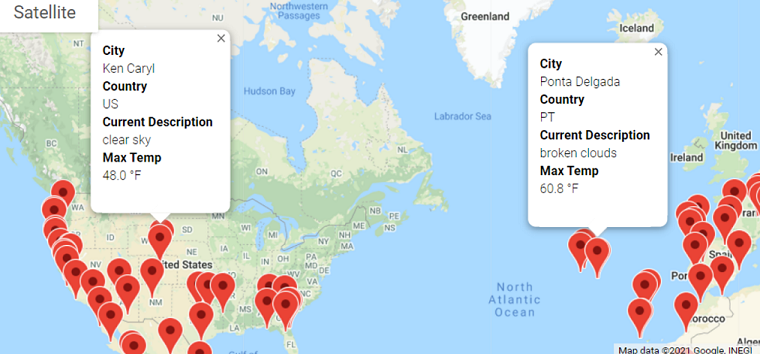
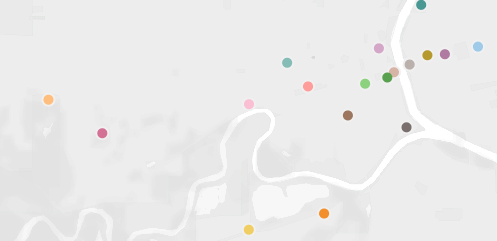
This project was designed to analyze weather data for the MyTripPlan app, and also to help the middle school STEM class project, with visualizations of statistical weather data relationships and for customer trip planning purposes. Not only can customers see locations with the range of temperatures of their preference, with nearby hotels, but a suggested 4-city driving tour/travel itinerary is provided, based on their preferences. First, a database of cities was created using random numbers to generate latitude and longitude. The Citipy dependency features a function which provides the nearest city to latitude and longitude coordinates, which this database is checked against. Weather data for each pair of coordinates for each city is obtained from an API call to openweathermap.org. A customer can enter their max and min preferred temperatures and cities which match their request are matched up with the cities in our database.